Modern organizations generate unprecedented volumes of data every day. Sales transactions, financial reports, customer interactions, operational systems, supply chains, digital marketing platforms, ERP solutions, CRM applications, and connected devices all produce valuable information.
Yet, despite this abundance of data, many executives still struggle to answer fundamental business questions:
- Which products generate the highest profitability?
- Where are operational bottlenecks occurring?
- Which markets are growing fastest?
- Why are customer acquisition costs increasing?
- Which business units require immediate attention?
- What risks are emerging across the organization?
The challenge is rarely the absence of data—it is the inability to transform fragmented information into timely, actionable intelligence.
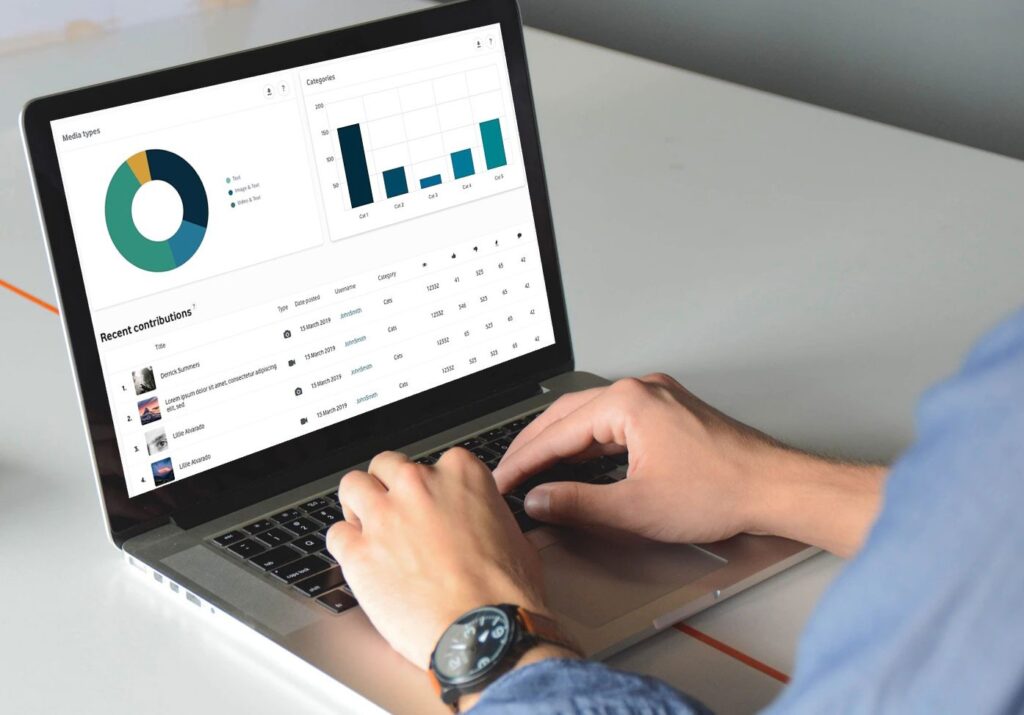
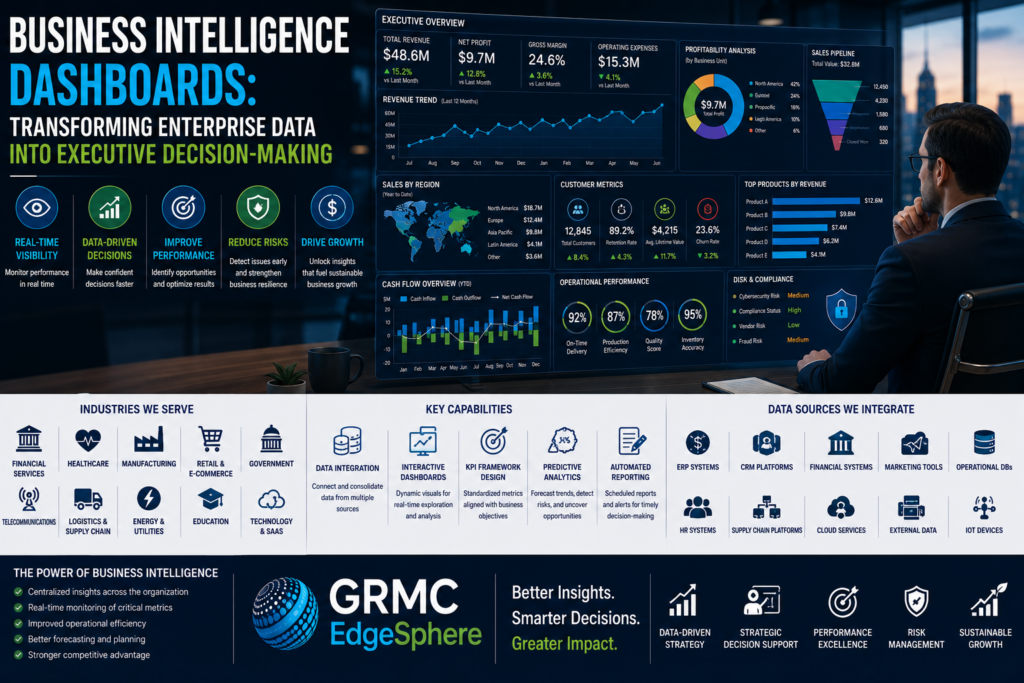
Business Intelligence (BI) Dashboards solve this challenge by consolidating data from multiple sources into interactive visual reports that provide decision-makers with real-time visibility into organizational performance.
For CEOs, CIOs, CFOs, government leaders, investors, and enterprise executives, BI dashboards have become indispensable tools for monitoring performance, identifying trends, managing risks, and driving strategic growth.
Industry Overview
Organizations across every sector are accelerating digital transformation initiatives. As businesses adopt cloud platforms, enterprise applications, automation technologies, and AI-powered systems, the volume and complexity of data continue to grow.
Without centralized reporting, decision-makers often rely on spreadsheets, disconnected reports, and manually compiled data, resulting in delayed decisions and inconsistent insights.
Business Intelligence Dashboards provide a unified view of organizational performance by integrating data from multiple systems into a single, accessible platform.
Common industries leveraging BI dashboards include:
- Financial Services
- Healthcare
- Manufacturing
- Government
- Retail and E-commerce
- Telecommunications
- Logistics and Supply Chain
- Energy and Utilities
- Education
- Hospitality
- Technology and SaaS
These organizations use dashboards not only to monitor operations but also to forecast trends, improve efficiency, and support strategic planning.
Key Challenges Organizations Face
Disconnected Data Sources
Many organizations operate multiple software platforms that do not communicate effectively.
Finance, sales, operations, customer service, and marketing often maintain separate datasets, creating fragmented decision-making.
Delayed Reporting
Traditional reporting methods require manual data collection and preparation, delaying access to critical business information.
Executives frequently receive reports after important opportunities or risks have already emerged.
Limited Visibility
Without centralized dashboards, leaders struggle to understand overall organizational performance.
Departmental reporting often fails to provide enterprise-wide insights.
Inconsistent Metrics
Different departments may calculate performance indicators differently, leading to conflicting reports and reduced confidence in decision-making.
Information Overload
Having access to thousands of reports does not necessarily improve decisions.
Executives require concise, relevant, and actionable information presented in an easily understandable format.
Market Research Insights
Organizations achieving high levels of digital maturity increasingly rely on Business Intelligence Dashboards as part of their executive management processes.
Executive Dashboards
Executive dashboards provide senior leadership with a comprehensive overview of strategic performance.
Typical metrics include:
- Revenue Growth
- Profit Margins
- Cash Flow
- Market Share
- Customer Growth
- Strategic KPIs
- Business Risks
- Operational Performance
These dashboards enable executives to monitor organizational health at a glance.
Operational Dashboards
Operational dashboards support day-to-day management by providing real-time visibility into business processes.
Examples include:
- Inventory Levels
- Production Efficiency
- Supply Chain Performance
- Service Delivery Metrics
- Project Status
- Workforce Productivity
Continuous monitoring allows organizations to respond quickly to operational challenges.
Customer Intelligence Dashboards
Customer-focused dashboards consolidate insights related to:
- Customer Acquisition
- Retention Rates
- Customer Lifetime Value
- Satisfaction Scores
- Net Promoter Score (NPS)
- Customer Churn
- Digital Engagement
These insights help organizations strengthen customer relationships and improve long-term profitability.
Sales and Marketing Dashboards
Marketing and sales leaders use dashboards to evaluate campaign effectiveness and revenue generation.
Common indicators include:
- Lead Generation
- Conversion Rates
- Sales Pipeline
- Marketing ROI
- Digital Campaign Performance
- Geographic Sales Distribution
Integrated reporting improves resource allocation and commercial performance.
Predictive Business Intelligence
Modern BI platforms increasingly incorporate predictive analytics to forecast future business outcomes.
Predictive dashboards help organizations anticipate:
- Sales trends
- Customer demand
- Inventory requirements
- Financial performance
- Operational risks
- Market opportunities
Forward-looking intelligence supports proactive decision-making.
Practical Recommendations
Organizations seeking greater value from business intelligence should adopt a strategic approach to dashboard implementation.
Define Clear Business Objectives
Dashboards should answer critical business questions rather than simply displaying large volumes of data.
Executive priorities should determine dashboard design.
Standardize Key Performance Indicators
Organizations should establish consistent definitions for performance metrics across all departments.
Standardized KPIs improve reporting accuracy and organizational alignment.
Integrate Enterprise Data Sources
Effective dashboards consolidate information from ERP systems, CRM platforms, financial software, HR systems, operational databases, and external market intelligence sources.
Integrated reporting provides a complete view of organizational performance.
Deliver Real-Time Insights
Decision-makers benefit most from timely information.
Automated data refresh and real-time reporting reduce delays and improve responsiveness.
Promote Data Literacy
Technology alone is insufficient.
Organizations should ensure that executives and managers understand how to interpret dashboard insights and apply them effectively in strategic decision-making.
How GRMC EdgeSphere Can Help
GRMC EdgeSphere helps organizations transform complex business data into meaningful intelligence through customized Business Intelligence Dashboard solutions.
Our multidisciplinary team combines market research, business intelligence, advanced analytics, digital transformation expertise, and strategic consulting to design dashboards that support confident executive decision-making.
Our Business Intelligence Services Include
Executive Dashboard Development
Design and implementation of executive dashboards that provide real-time visibility into organizational performance and strategic KPIs.
Business Performance Analytics
Analysis of financial, operational, sales, and customer data to identify trends, opportunities, and performance gaps.
Market Intelligence Integration
Integration of external market research, industry benchmarks, and competitive intelligence into executive reporting environments.
KPI Framework Design
Development of standardized performance indicators aligned with organizational objectives and governance requirements.
Interactive Reporting Solutions
Creation of dynamic dashboards that enable users to explore data, monitor trends, and generate customized reports.
Predictive Analytics and Forecasting
Application of advanced analytics and forecasting models to support proactive planning and risk management.
Decision Support Consulting
Strategic advisory services that help organizations convert business intelligence into practical actions that improve operational efficiency, customer outcomes, and long-term competitiveness.
GRMC EdgeSphere serves enterprises, government agencies, financial institutions, technology companies, healthcare organizations, manufacturers, and international businesses seeking to strengthen decision-making through data-driven insights.
Conclusion
Data has become one of the world’s most valuable business assets, but its true value is realized only when it is transformed into actionable intelligence.
Business Intelligence Dashboards provide executives with the visibility needed to monitor performance, identify opportunities, manage risks, and respond quickly to changing market conditions.
Organizations that implement effective BI strategies are better equipped to improve operational efficiency, optimize resource allocation, enhance customer experiences, and achieve sustainable growth.
As digital transformation accelerates, organizations that embrace real-time business intelligence will gain a significant competitive advantage through faster, smarter, and more informed decision-making.
At GRMC EdgeSphere, we empower organizations with advanced Business Intelligence Dashboard solutions that convert data into strategic insight, enabling leaders to make confident decisions that drive measurable business success.